Nmon Monitoring Tool
- cpu
- memory
- network
- disks
- file systems
- nfs
- top processes
- resources
- power micro-partition
Installing Nmon Monitoring Tool in Linux
If you are using a Debian based Linux distribution you can easily install the Nmon command-line utility by grabbing it from the default repositories. To install, Open a new terminal (CTRL+ALT+T) and use the following command.$ sudo apt-get install nmonAre you a Fedora user? To install in your machine open a new terminal and run the following command.
$ sudo yum install nmonCentOS/RHEL users can install it, by downloading it from http://pkgs.repoforge.org/nmon/. Alternatively, you can also install by enabling RPMForge Repository.
How to use Nmon to Monitor Linux Performance
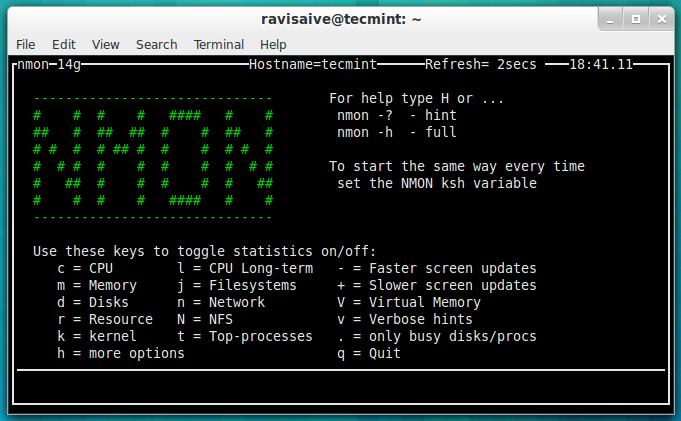
Once the installation of Nmon has been finished and you launch it from the terminal by typing the ‘nmon‘ command you will be presented with the following output.# nmon
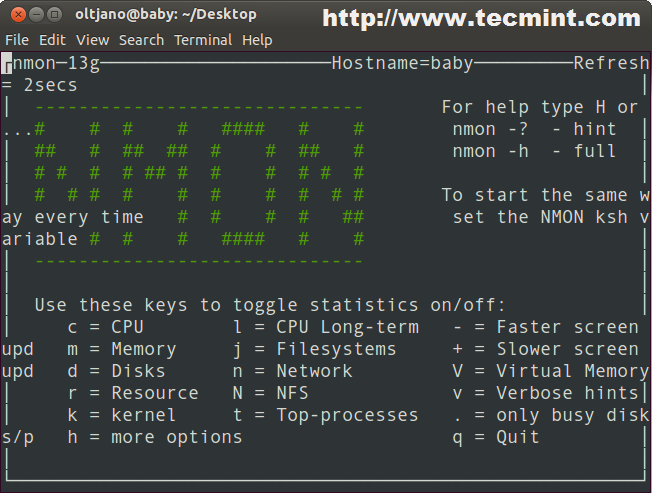
Nmon Preview
Check CPU by processor
For example, if you would like to collect some statistics on CPU performance you should hit the ‘c‘ key on the keyboard of the system you are using. After hitting the ‘c‘ key on my keyboard I get a very nice output that gives me information on my CPU usage.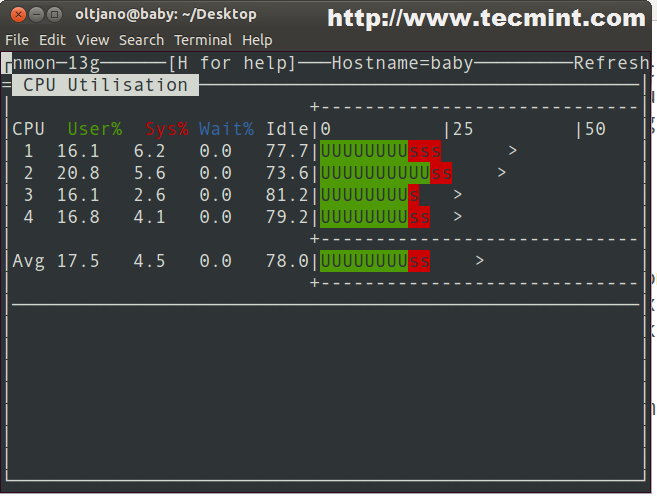
CPU by Processor
- m = Memory
- j = Filesystems
- d = Disks
- n = Network
- V = Virtual Memory
- r = Resource
- N = NFS
- k = kernel
- t = Top-processes
- . = only busy disks/procs
Top Process Statistics
To get stats on top processes that are running on your Linux system press the key ‘t‘ on your keyboard and wait for the information to show up.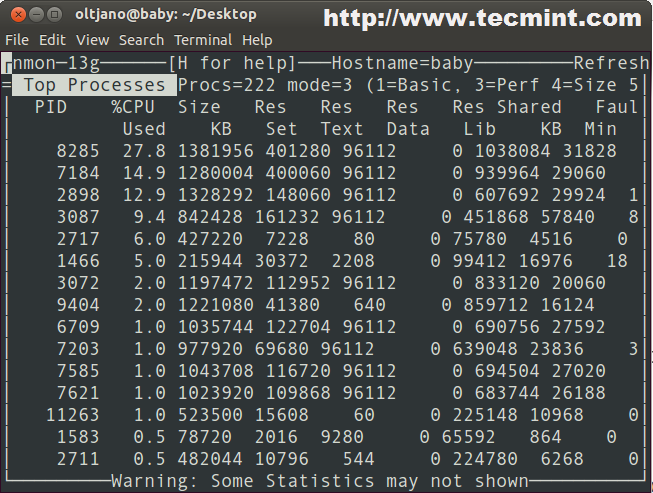
Top Processes
# topIt looks like I am running the top process monitoring utility when I use the key ‘t‘ with the Nmon tool to me.
Check Network Statistics
How about some network stats? Just press ‘n‘ on your keyboard.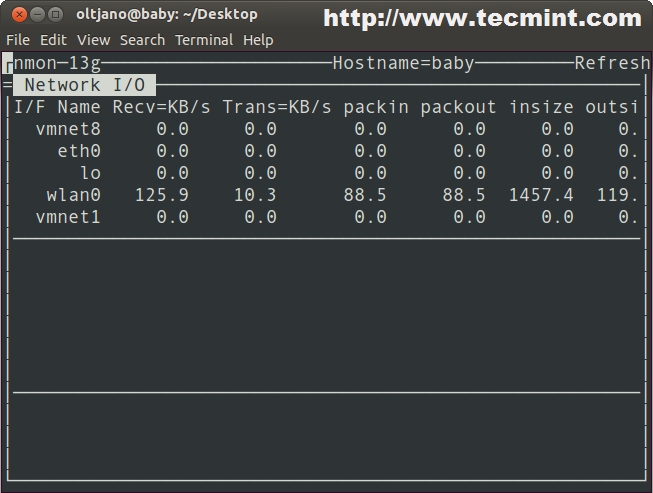
Network Statistics
Disk I/O Graphs
Use the ‘d‘ key to get information on disks.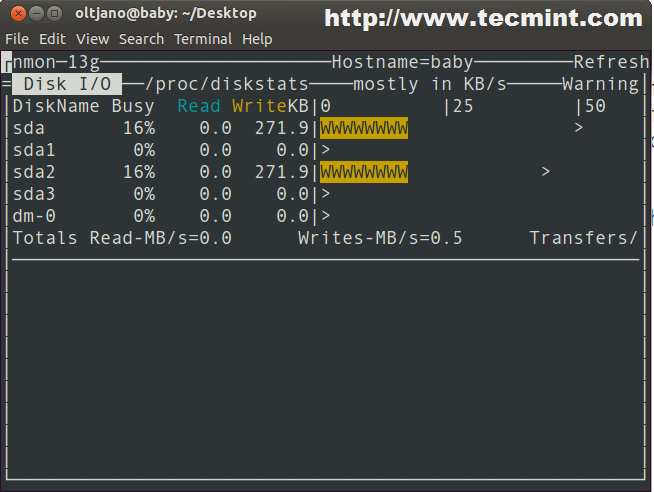
Monitor Disk I/O
Check Kernel Information
A very important key to use with this tool is ‘k‘, it is used to display some brief information on the kernel of your system.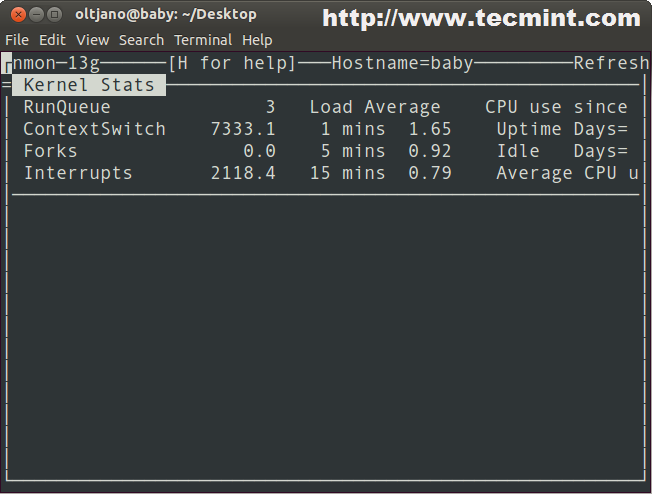
Check Linux Kernel Information
Get System Information
A very useful key for me is the key ‘r‘ which is used to give information on different resources such as machine architecture, operating system version, Linux version and CPU. You can get an idea of the importance of the key ‘r‘ by looking the following screenshot.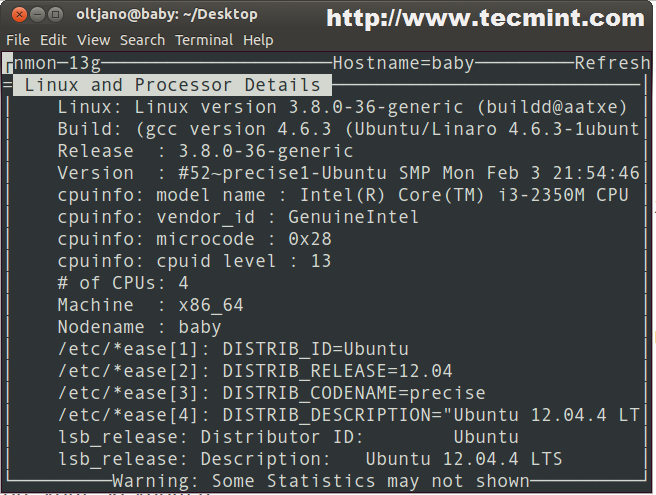
System Information
Check File System Statistics
To get stats on the file systems press ‘j‘ on your keyboard.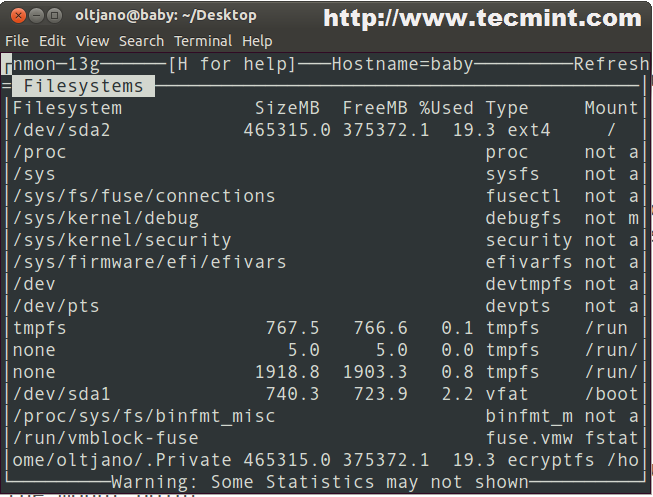
File System Statistics
Display NFS Data
The key ‘N‘ can help to collect and display data on NFS.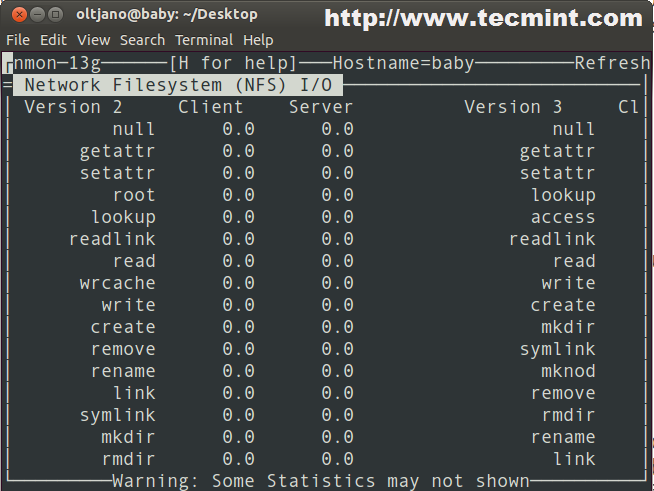
NFS Data
# nmon -f -s13 -c 30After running the above command you will get a file with ‘.nmon‘ extension in the directory where you were while working with the tool. What is the ‘-f‘ option? The following is a simple and short explanation of the options used in the above command.
- The -f means you want the data saved to a file and not displayed on the screen.
- The -s13 means you want to capture data every 13 seconds.
- The -c 30 means you want thirty data points or snap shots.
Conclusion
There are many tools that can do the job of the Nmon utility, but none of them is so easy to use and friendly to a Linux beginner. Unfortunately the tool does not have as many features as other tools such as collectl and it can not provide in-depth stats to the user.At the end I can say it is a very nice utility for a Linux system administrator, especially for someone that is not familiar with command-line options and commands.
Nessun commento:
Posta un commento