Install IPTraf LAN Monitoring
This article guides you on how to install IPTraf monitoring tool using YUM command.
Installing IPTraf
IPTraf is part of the Linux distribution and can be installed on RHEL, CentOS and Fedora server’s using yum command from terminal.# yum install iptrafUnder Ubuntu, iptraf can be installed using Ubuntu Software Center or ‘apt-get’ method. For example, use the ‘apt-get‘ command to install it.
$ sudo apt-get install iptraf
IPTraf Usage
Once IPTraf installed, run the following command from the terminal to launch an ascii based menu interface that will allow you to view current IP traffic monitoring, General interface statistics, Detailed interface statistics, Statistical breakdowns, Filters and also provide some configure options where you can configure as per your need.[root@tecmint ~]# iptraf
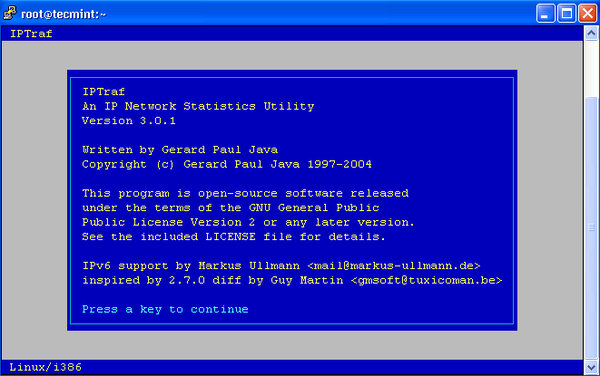
IPTraf Startup Screen
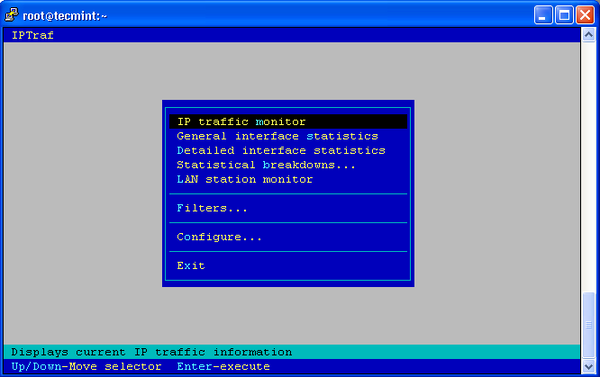
IPTraf System Menu
IP traffic monitor
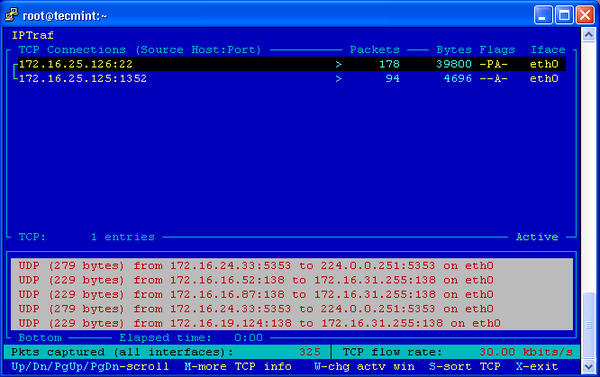
IP Traffic Monitor
General interface statistics
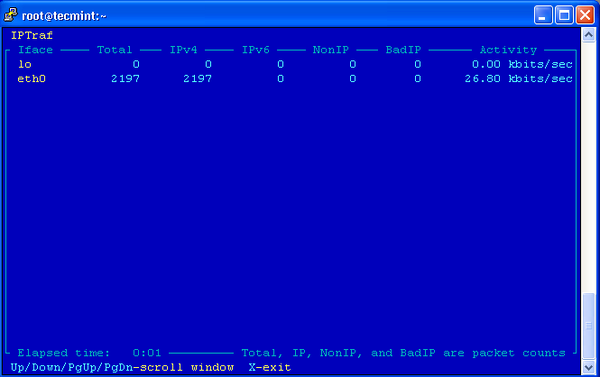
IPTraf General interface statistics
Detailed interface statistics

IPTraf Detailed interface statistics
Statistical breakdowns
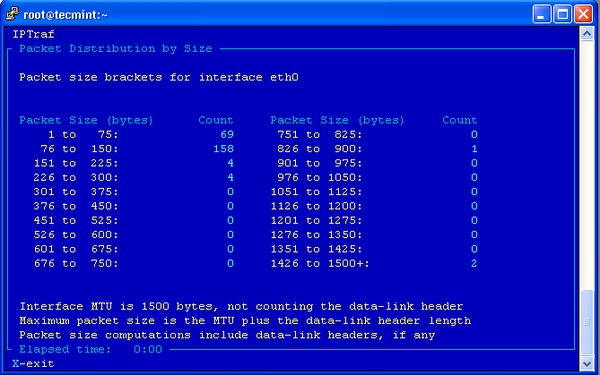
IPTraf Statistical breakdowns
LAN station monitor
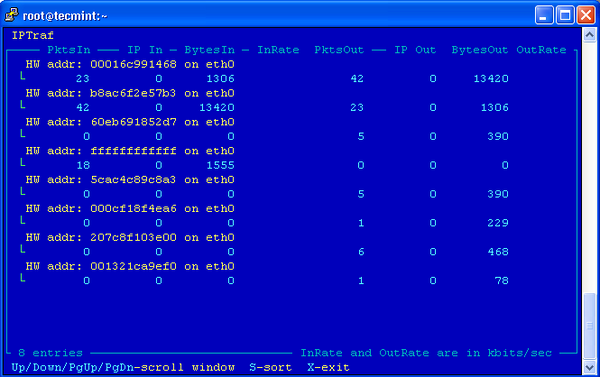
IPTraf LAN station monitor
Configure
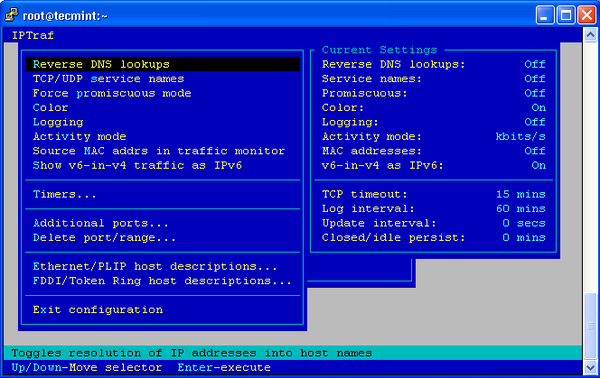
IPTraf Configure
IPTraf Options
Using “iptraf -i” will immediately start the IP traffic monitor on a particular interface. For example, the following command will start the IP traffic on interface eth0. This is the primary interface card that attached to your system. Else you can also monitor all your network interface traffic using argument as “iptraf -i all“.# iptraf -i eth0
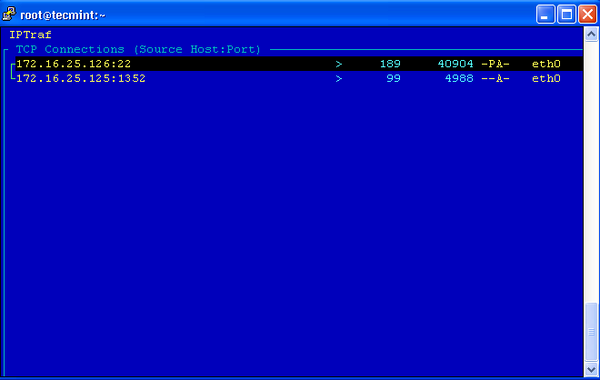
IPTraf Eth0 Monitoring
# iptraf -s eth0
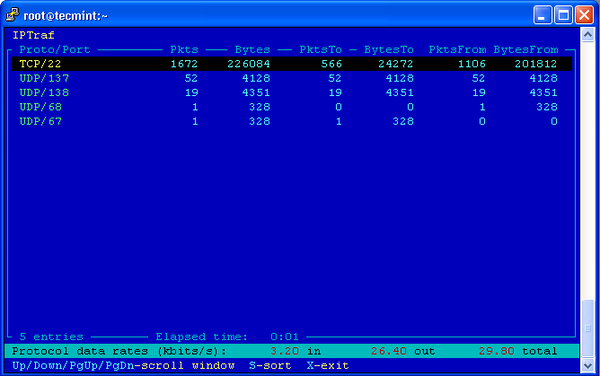
IPTraf TCP/UDP Monitoring
Fonte
Nessun commento:
Posta un commento